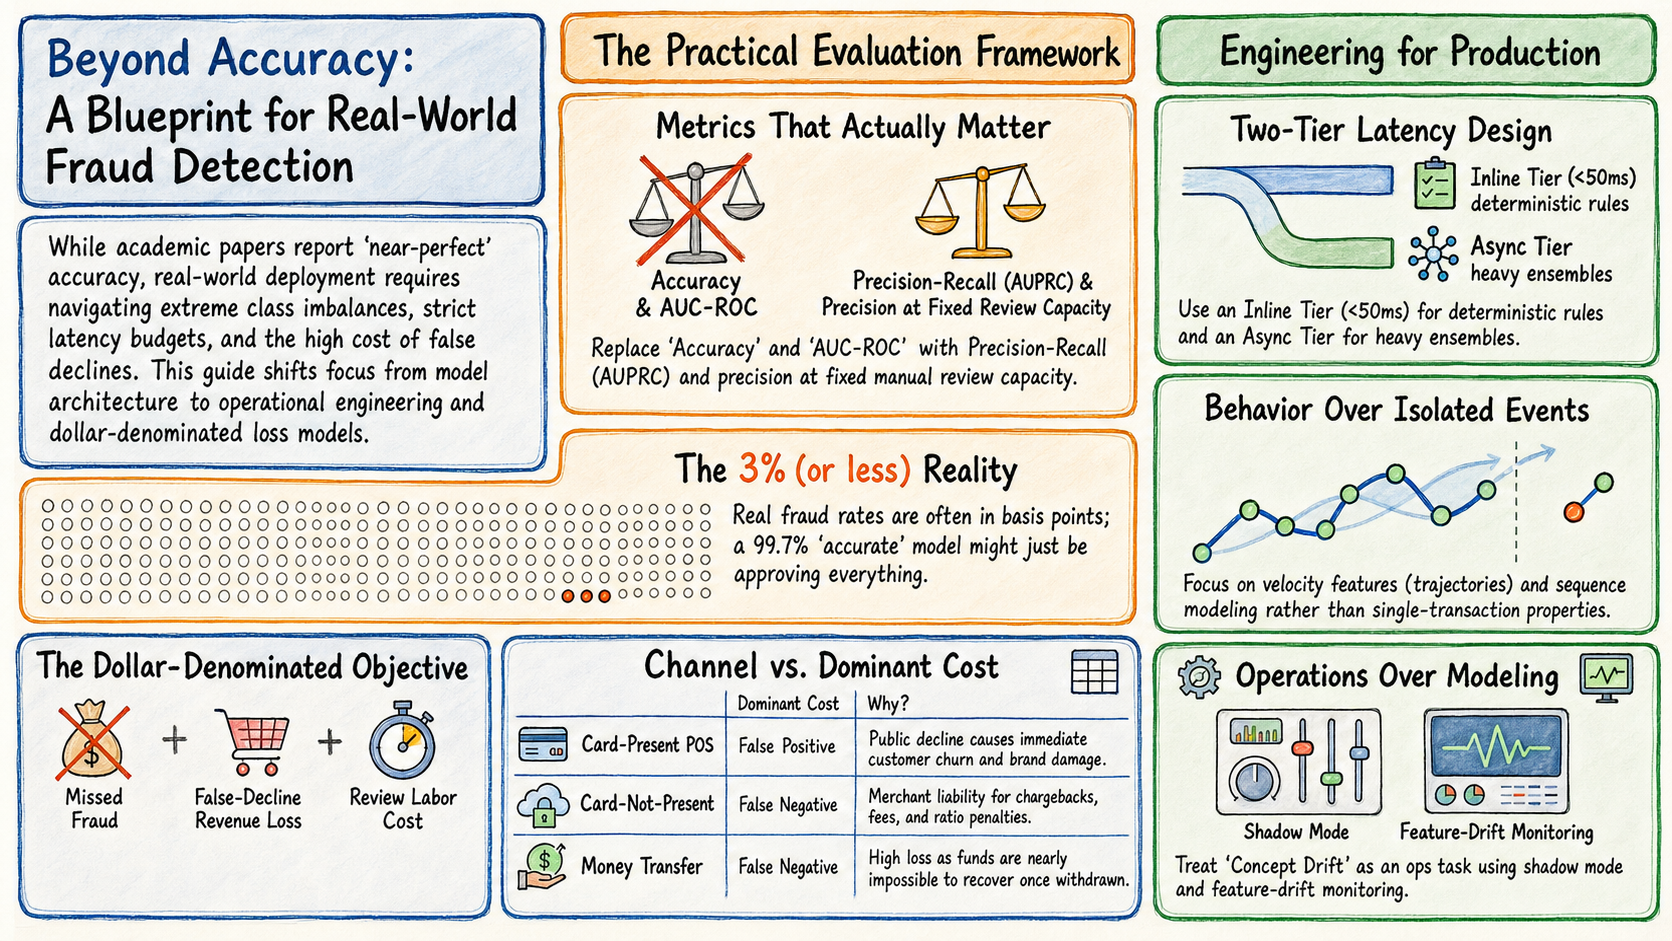
Fraud-detection papers regularly report near-perfect accuracy on public datasets. Almazroi and Ayub’s 2023 IEEE Access paper is a recent example: a ResNeXt-embedded GRU classifier, hyperparameters tuned with the Jaya algorithm, evaluated on IEEE-CIS, PaySim, and the European card dataset.
The architecture is not the transferable part. The paper opens with a constraint list — class imbalance, cost sensitivity, temporal dependence, concept drift, dimensionality — that is a better specification for a payment risk system than the model itself. Those constraints map onto POS and fintech operations more directly than any claimed AUC.
This post keeps the design principles worth shipping, and flags where the paper’s own numbers should make you cautious. The same caution applies when a fraud vendor pitches you.
1. Fraud is a 3% problem, and that reshapes everything downstream
The paper reports fraudulent activity at roughly 3.3% of transactions in its working dataset. In production card portfolios the rate is often an order of magnitude lower — basis points, not percent.
That single fact invalidates most of the metrics people quote:
- Accuracy is nearly useless. A model that approves everything scores 99.7% on a 30bps fraud rate.
- AUC-ROC is optimistic. It is dominated by the negative class. Prefer AUPRC (precision-recall).
- What you need in practice is precision at a fixed recall, or better, precision at a fixed alert volume. Manual review capacity is finite, and that capacity is the real constraint on policy.
For a POS deployment, state the target in operational units: we can review 400 flagged transactions a day; what fraud value do we catch in those 400? That reframing changes model selection.
Define the evaluation metric as a dollar figure before you pick a model. Expected loss ≈ (missed fraud value) + (false-decline revenue × repeat-customer multiplier) + (review labour cost). Everything else is a proxy.
2. The cost matrix is the product decision
The paper asserts that false positives cost more than false negatives: a wrongly declined legitimate transaction creates administrative expense, while a missed fraud only costs the transaction value.
That asymmetry is contestable, and the disagreement is where the design work lives. It flips by channel:
| Context | Dominant cost | Why |
|---|---|---|
| Card-present POS, low ticket | False positive | Customer is at the till. A decline is public, immediate, and pushes them to another card or another store. |
| Card-not-present, high ticket | False negative | Liability usually sits with the merchant under CNP chargeback rules. Fraud value + chargeback fee + ratio penalties. |
| Recurring / subscription | False positive | A declined renewal often becomes involuntary churn; lifetime value dwarfs the ticket. |
| Money transfer, cash-out | False negative | Funds are hard to recover once withdrawn. |
PaySim, mentioned almost in passing, points the same way. Normal traffic is dominated by CASH_OUT; fraudulent traffic splits more evenly between CASH_OUT and TRANSFER. That is a sequence signature (transfer then cash-out), not a property of any single transaction.
A risk engine therefore needs per-channel, per-segment thresholds, not one global score cutoff. Card-present terminals and CNP checkout should not share a decision boundary. If a vendor gives you one dial, that is a limitation, not a simplification.
3. Sequence modelling is the idea worth taking
The GRU layer is the part most worth stealing. Fraud is rarely a property of a transaction in isolation; it is a property of a trajectory. A €40 purchase is unremarkable. A €40 purchase after three declines and a $1 authorisation at 03:00 in a different MCC is not.
You do not need a neural network to start:
- Velocity features across windows: transactions per card per 1m / 1h / 24h, distinct terminals per card, distinct cards per terminal, amount deltas.
- Terminal-side sequences. This is the POS-specific advantage public datasets lack. A device that suddenly shifts ticket-size distribution, tip pattern, or entry-mode mix (chip → manual key entry) is a signal for merchant-side fraud and terminal tampering, not only card fraud.
- Entry mode and fallback tracking. Chip-to-magstripe fallback rates per terminal are among the highest-yield card-present features and appear in almost none of the public datasets.
The paper’s own EDA also shows what does not separate: card brand (Visa / Mastercard / Amex / Discover) and card type (credit / debit). They report that honestly. Instrument-type and demographic features are mostly noise; behavioural features carry the signal.
One architectural caveat: the paper runs convolutional ResNeXt blocks over tabular transaction data. Convolution assumes local spatial structure that tabular columns do not have. For most payment teams, gradient-boosted trees on well-engineered velocity features remain the honest baseline. Add sequence models where you have genuine ordered history.
4. Latency is the constraint the paper barely touches
The paper measures execution time and reports its model as fastest, which is good practice. It measures batch throughput, not authorisation latency.
In an authorisation flow the budget is hard. Issuer, scheme, and gateway each impose timeouts; the end-to-end window at the terminal is typically a couple of seconds. The risk decision gets a slice of that — realistically tens of milliseconds after network hops, HSM work, and the auth itself.
That forces a two-tier design papers rarely specify:
Inline tier (sub-50ms): deterministic rules, cached velocity counters, a small model. Define timeout behaviour explicitly and per channel: fail-open (approve) or fail-closed (decline). Fail-open protects conversion and is the usual answer for low-ticket card-present; fail-closed protects loss on high-risk CNP.
Async tier (seconds to minutes): heavier ensemble, graph features, cross-merchant signals. Output feeds holds, step-up authentication, account review, and the labels that retrain the inline tier.
Feature freshness is where this breaks. A velocity counter that is 30 seconds stale is useless against card testing, which is a burst-rate attack. Budget for a streaming counter store, not a nightly aggregate table.
5. Concept drift is an ops problem, not a modelling one
The paper lists concept drift as a core challenge and then, like most papers, evaluates on a static split. Fraud is adversarial. The model decays from the day it ships, and the decay is partly caused by the model: you block a pattern, the pattern changes.
Treat that as operating discipline:
- Champion/challenger in shadow mode. New models score live traffic without deciding, for weeks, before promotion.
- Feature-drift monitoring separate from performance monitoring. Feature distributions shift before metrics do; that gap is lead time.
- Label latency awareness. Chargebacks arrive 30–120 days after the transaction. A “current” performance number is often a measurement of a past model. Build reporting around that delay instead of pretending it away.
- Seasonality carve-outs. Black Friday, holidays, and payday cycles break naive velocity thresholds. Model the seasonality or maintain seasonal rule overlays.
6. Where the paper overreaches — and why that matters commercially
You evaluate vendor claims for a living. Several things in the paper do not hold up cleanly:
- Headline metrics look internally inconsistent. In the comparison tables, baselines are given roughly 56% precision and 56% recall alongside 13.6% accuracy — arithmetically incompatible on a two-class problem under ordinary definitions. Elsewhere Matthews correlation coefficients (0.997) sit awkwardly against reported accuracies (0.981); depending on class balance and metric definitions, those figures may not be jointly coherent. Either way, the tables do not inspire trust.
- Reported figures disagree with each other. The fraud base rate is 3.27% in the text and 3.5% in the corresponding figure. A transformer baseline’s AUC is 0.85 in one figure, “approximately 0.88” in the text, and 0.9229 in a table.
- There are signs of resampling leakage. The paper’s own ablation shows accuracy dropping from ~98% to ~83% without SMOTE. That gap is the classic signature of oversampling applied before the train/test split — synthetic minority points derived from test-set neighbours leaking into training. Correct practice is to resample training folds only. If that happened here, the headline number is inflated.
- Editorial sloppiness. The results section for the card-fraud dataset discusses tuning weights for “malware detection capabilities.” The abstract and conclusion frame credit card fraud as a wireless-communications and cyber-warfare problem, which it is not.
The Limitations section is more careful: generalisability beyond the primary dataset is “relatively limited.”
When someone quotes a fraud-detection accuracy number, the number alone tells you nothing. Ask:
- What was the fraud base rate in the evaluation set?
- Was the test set resampled or balanced in any way? (If yes, discard the number.)
- Is the split temporal — trained on earlier data, tested on later — or random? Random splits leak future information and overstate fraud performance badly.
- What is the precision at your review capacity, and what is the false-decline rate at that operating point?
- How was the label defined, and how long after the transaction was it available?
- What happens on timeout?
A vendor who can answer those six is worth a pilot. One who leads with accuracy is not.
7. What to build
If specifying a payment risk layer with this paper in hand:
- Start with a cost model, not a classifier. Dollar-denominated objective, per channel.
- Ship rules and velocity counters first. Auditable, explainable to a regulator, and enough to cover a large share of loss.
- Add gradient-boosted trees on engineered behavioural features. This is the honest baseline many deep-learning papers fail to beat once evaluation is done properly.
- Reach for sequence models only where you have real ordered history — per card, per device, per terminal — and evaluate on a temporal split.
- Build the two-tier inline/async split from day one. Retrofitting latency discipline is painful.
- Instrument for drift and label latency before you optimise the model.
- Keep explainability in the design. Adverse action, model-risk governance, and merchant dispute handling need a reason code, not a score. The paper names interpretability as a requirement and then does not address it — a gap you cannot afford.
Source and further reading
Almazroi, A. A., & Ayub, N. (2023). “Online Payment Fraud Detection Model Using Machine Learning Techniques.” IEEE Access, 11. DOI: 10.1109/ACCESS.2023.3339226. Published under CC BY-NC-ND 4.0.
Public datasets referenced (useful for prototyping, not for card-present realism):
- IEEE-CIS Fraud Detection — 433 features, ~590k transactions; richest feature set of the three.
- PaySim — synthetic mobile money; useful for sequence / transfer-pattern work.
- European Credit Card Fraud (ULB) — PCA-anonymised, small; the standard smoke test.
None include terminal-level or entry-mode data. That is the gap between academic fraud detection and card-present POS reality. If you are building for POS, your own telemetry is more valuable than any of them.